In the world of modern backend systems, managing job queues efficiently is a crucial part of building scalable and reliable applications.BullMQ dashboard stands out as a powerful and user-friendly interface designed to monitor and manage queues powered by BullMQ — a robust Node.js-based queue library built on Redis. This article provides a deep dive into the features, benefits, and usage of the BullMQ Dashboard.
What is the BullMQ Dashboard?
The BullMQ Dashboard is a visual tool that offers developers a comprehensive view into the status and activity of their BullMQ queues. It serves as a graphical interface that allows users to interact with job queues, inspect job progress, monitor job failures, and debug issues in real-time. Rather than relying solely on CLI tools or custom scripts, the BullMQ Dashboard simplifies queue management with an intuitive UI.
Key Features of the BullMQ Dashboard
Real-Time Monitoring
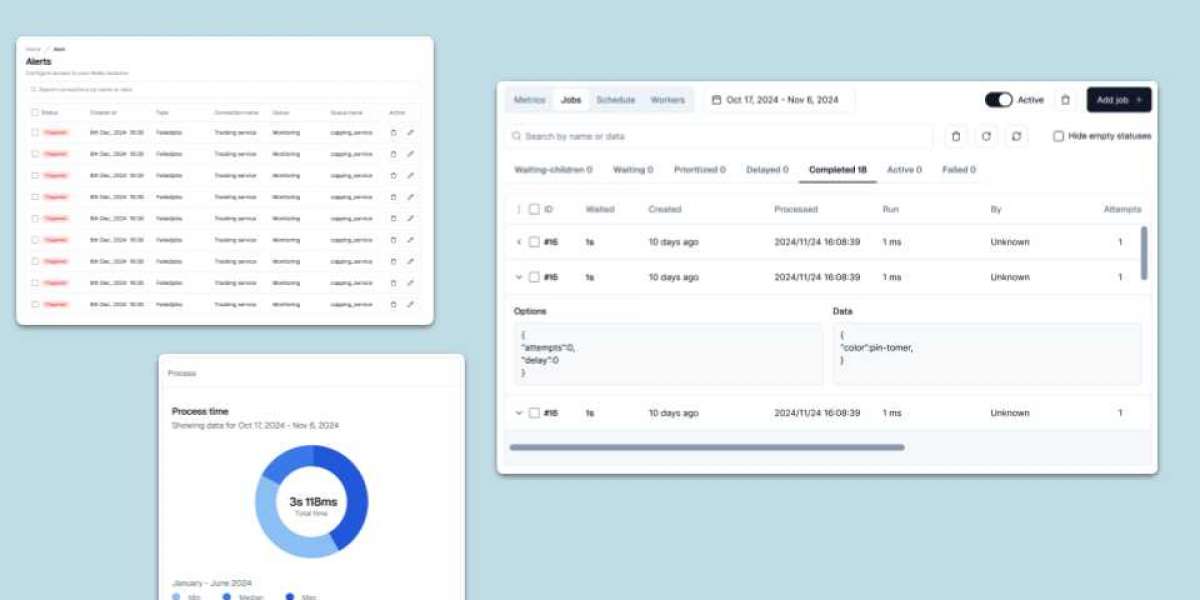
The BullMQ Dashboard provides real-time updates of your queue's job statuses. Whether jobs are waiting, active, completed, failed, or delayed, the dashboard offers a live snapshot so you can react instantly to any anomalies.Job Inspection
You can inspect individual jobs to view their data payload, progress percentage, error messages (if failed), and timestamps. This is especially useful for debugging complex jobs.Retry and Remove Jobs
The BullMQ Dashboard allows users to retry failed jobs manually or remove them from the queue. This control is vital for maintenance and recovery workflows.Queue Statistics
Get insights into job throughput, average processing times, and queue length. These metrics help developers identify performance bottlenecks and optimize job handling.Multiple Queue Support
If your application uses multiple queues, the BullMQ Dashboard can aggregate and display all of them in one place, streamlining management and monitoring.Custom Job Filtering
With advanced filters, you can search for specific jobs using job IDs, states, or custom data fields. This functionality significantly reduces the time spent tracking down individual tasks.
How to Use the BullMQ Dashboard
To get started with the BullMQ Dashboard, you typically need to install it as part of your development toolkit. Some popular options include open-source projects like Arena or community-supported dashboards tailored for BullMQ. The general process includes:
Install Redis and BullMQ
Redis acts as the backbone for BullMQ. Ensure that you have a running Redis instance and have installed BullMQ via npm.Integrate the Dashboard
Integrate the BullMQ Dashboard tool of your choice with your BullMQ setup. This usually involves setting up an express server or using a standalone dashboard tool that connects to your Redis instance.Configure Queue Connections
Provide the Redis connection details and queue names in the dashboard configuration. Once connected, the dashboard starts visualizing the queue activity.Access the Dashboard
Launch the dashboard in your browser to start managing and observing your jobs through an intuitive interface.
Benefits of Using the BullMQ Dashboard
Improved Debugging: See failures and error traces at a glance.
Enhanced Productivity: Manage and monitor jobs without writing manual Redis commands.
Faster Recovery: Retry and fix job flows with a few clicks.
Better Insights: Visual data helps spot trends and anomalies.
Final Thoughts
The BullMQ Dashboard is a vital tool for developers building complex Node.js applications with background job processing. By combining the power of Redis with a sleek visual interface, it allows you to maintain, monitor, and optimize job queues effectively. Whether you're running a single queue or managing a high-scale distributed system, incorporating the BullMQ Dashboard into your development and operations workflow is a smart move for long-term scalability and reliability.
You said:
ChatGPT said:
BullMQ Monitoring: Ensuring Reliable Queue Performance
When it comes to managing background jobs in Node.js applications, BullMQ is one of the most robust and feature-rich libraries available. However, the effectiveness of any job queue system depends heavily on how well it is monitored. BullMQ monitoring plays a vital role in identifying bottlenecks, failures, and inefficiencies before they impact your production environment. This article explores the key concepts, tools, and best practices for effective BullMQ monitoring.
Why is BullMQ Monitoring Important?
BullMQ handles tasks such as email dispatching, video encoding, data synchronization, and other asynchronous operations. Without proper BullMQ monitoring, failures may go unnoticed, leading to data loss, increased latency, and poor user experience. Monitoring allows you to:
Detect job failures in real-time
Monitor queue latency and throughput
Track job lifecycle (waiting, active, completed, failed, delayed)
Observe Redis usage and performance
Ensure SLA compliance for background processes
Core Metrics to Watch in BullMQ Monitoring
Effective BullMQ monitoring involves tracking a set of key metrics:
Job States Count
Waiting, Active, Completed, Failed, Delayed, Paused
Helps assess the health and flow of jobs
Job Duration Processing Time
Tracks how long jobs are taking to complete
Identifies slow jobs or workers
Failure Rate
Monitors percentage of jobs that fail over time
Useful for proactive debugging
Queue Length
Indicates backlog and potential delays
Critical for scaling decisions
Retries Attempts
Helps understand how often jobs are retried and why
Tools for BullMQ Monitoring
Several tools and integrations can help with BullMQ monitoring, including:
1. BullMQ Dashboard
The BullMQ Dashboard is a dedicated UI to visually inspect queue states, job details, and real-time performance. It's ideal for development and light monitoring.
2. Prometheus + Grafana
By using the @bull-monitor/root package or custom exporters, you can expose BullMQ metrics to Prometheus and visualize them in Grafana dashboards. This is recommended for production-grade BullMQ monitoring.
3. Log Aggregation Services
Tools like ELK Stack (Elasticsearch, Logstash, Kibana) or services like Datadog, New Relic, or Sentry can collect logs from your job processors and offer insights into errors and trends.
4. Health Checks
Set up periodic health checks to ping queues and ensure jobs are being processed within expected timeframes. Alerts can be triggered if thresholds are breached.
Best Practices for BullMQ Monitoring
Use Tags and Metadata
Add custom tags to jobs so you can filter and analyze them more effectively.Log Job Lifecycle Events
Hook into BullMQ events (completed,failed,stalled, etc.) and log important details for further analysis.Set Reasonable Retry Strategies
Use exponential backoff and limited retries to avoid endless loops in case of recurring failures.Alert on Anomalies
Set up alerts for spikes in failure rates, job durations, or queue length to act before issues escalate.Track Resource Usage
Monitor Redis memory and CPU usage, especially under high queue load.
Conclusion
BullMQ monitoring is not just a technical requirement—it’s a necessity for any application relying on background job processing. With the right combination of tools, metrics, and practices, you can ensure that your queues remain healthy, efficient, and scalable. Whether you're in development or production, investing in a solid BullMQ monitoring setup will save you time, prevent outages, and deliver a better experience to your users.